用Python绘制正弦曲线
发布时间:2019-09-07 08:10:53编辑:auto阅读(3912)
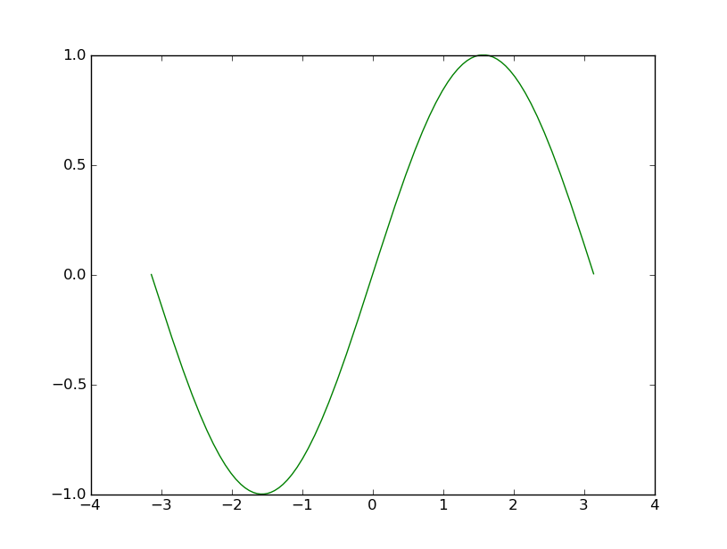
- >>>import numpy as np
- >>> import matplotlib.pyplot as plt
- >>> x=np.arange(-np.pi,np.pi,0.01)
- >>> y=np.sin(x)
- >>> plt.plot(x,y,'g')
- [<matplotlib.lines.Line2D object at 0x01AA20F0>]
- >>> plt.show()
今天学了Python 绘制了一幅正弦曲线 哈哈
需要numpy Python 库的支持
上一篇: python的logging模块详解
下一篇: Python 08 re 正则表达式
- openvpn linux客户端使用
51746
- H3C基本命令大全
51430
- openvpn windows客户端使用
41840
- H3C IRF原理及 配置
38612
- Python exit()函数
33107
- openvpn mac客户端使用
30096
- python全系列官方中文文档
28768
- python 获取网卡实时流量
23765
- 1.常用turtle功能函数
23679
- python 获取Linux和Windows硬件信息
22047
- Ubuntu本地部署dots.ocr
77°
- Python搭建一个RAG系统(分片/检索/召回/重排序/生成)
2274°
- Browser-use:智能浏览器自动化(Web-Agent)
2967°
- 使用 LangChain 实现本地 Agent
2472°
- 使用 LangChain 构建本地 RAG 应用
2416°
- 使用LLaMA-Factory微调大模型的function calling能力
3017°
- 复现一个简单Agent系统
2423°
- LLaMA Factory-Lora微调实现声控语音多轮问答对话-1
3230°
- LLaMA Factory微调后的模型合并导出和部署-4
5324°
- LLaMA Factory微调模型的各种参数怎么设置-3
5146°
- 姓名:Run
- 职业:谜
- 邮箱:383697894@qq.com
- 定位:上海 · 松江