python 3D绘制立体几何
发布时间:2019-08-07 14:07:05编辑:auto阅读(3080)
直接复制就能用,写的简单,请勿吐槽
import numpy as np
import mpl_toolkits.mplot3d
import matplotlib.pyplot as plt

x=[0,3,0,3,1.5]
y=[0,0,3,3,1.5]
z=[0,0.8,1.5,2.3,3]

ax=plt.subplot(111,projection='3d')
for i in range(len(x)):
    for j in range(len(y)):
        ax.plot((x[i],x[j]),(y[i],y[j]),(z[i],z[j]),color='red');

for i in range(len(x)):
    ax.text(x[i],y[i],z[i],i,color='blue')


ax.set_zlabel('z')
ax.set_ylabel('y')
ax.set_xlabel('x')
plt.show()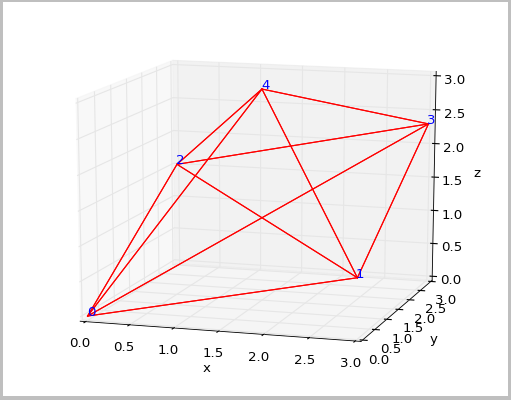
上一篇: Python进行远程视频监控
下一篇: python生成安装文件 msi
- openvpn linux客户端使用
52033
- H3C基本命令大全
51890
- openvpn windows客户端使用
42126
- H3C IRF原理及 配置
38971
- Python exit()函数
33471
- openvpn mac客户端使用
30422
- python全系列官方中文文档
29056
- python 获取网卡实时流量
24082
- 1.常用turtle功能函数
23998
- python 获取Linux和Windows硬件信息
22345
- LangChain1.0-Agent-部署/上线(开发人员必备)
60°
- LangChain1.0-Agent-Spider实战(爬虫函数替代API接口)
104°
- LangChain1.0-Agent(进阶)本地模型+Playwright实现网页自动化操作
127°
- LangChain1.0-Agent记忆管理
115°
- LangChain1.0-Agent接入自定义工具与React循环
133°
- LangChain1.0-Agent开发流程
126°
- LangChain1.0调用vllm本地部署qwen模型
152°
- LangChain-1.0入门实践-搭建流式响应的多轮问答机器人
165°
- LangChain-1.0入门实战-1
166°
- LangChain-1.0教程-(介绍,模型接入)
172°
- 姓名:Run
- 职业:谜
- 邮箱:383697894@qq.com
- 定位:上海 · 松江